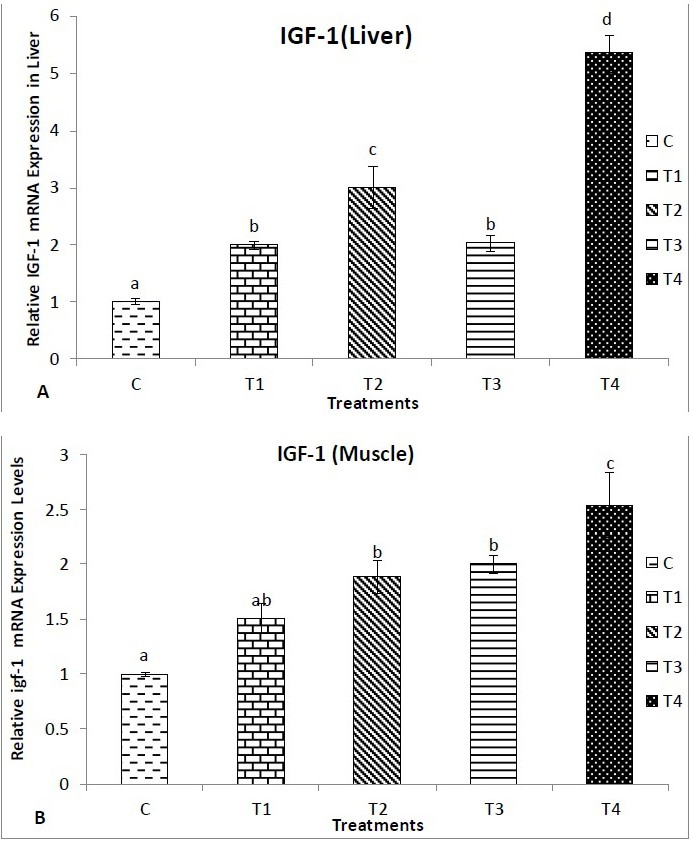
Fig. 5. Expression of IGF 1 mRNA in the (A) Liver and (B) muscle of L. rohita with different treatment groups using real-time quantitative PCR, Each bar represents the mean ± SE (n = 6). Letters denote significant differences between the control group and treatment groups (p<0.05).